Key takeaways:
The global economy has a large impact on cargo container shipping volumes. According to the International Monetary Fund (IMF), world gross domestic product (GDP) is expected to grow by 2.9 percent in 2024 and 3.2 percent in 2025. Additional IMF data also indicates projected GDP growth of specific regions.
| Region | Growth for 2024 | Growth for 2025 |
| East & Southeast Asia | 3.8 Percent | 3.8 Percent |
| Europe & Mediterranean | 1.8 Percent | 2.3 Percent |
| North America | 1.6 Percent | 1.8 Percent |
| Indian Sub Cont & Middle East | 5.2 Percent | 5.4 Percent |
| South & Central America | 2.4 Percent | 2.7 Percent |
Provided by IMF via BIMCO
While the level of growth for East & Southeast Asia are expected to stay the same, there will be a gradual rise in GDP for other regions. The expansion of these economies results in increased global trade, which means more containers are being put to use.
Before getting into the growth of containerized shipping, it’s important to understand the difference between head-haul and regional trade. Head-haul refers to a primary trade lane that carriers use due to its revenue-generating potential, while regional trade lanes refer to cargo traveling within specific geographic areas.
BIMCO has accumulated container shipping statistics that project a growth in volume for these lanes.
As with the growth of global GDP, container volumes are projected to gradually rise during this year and the next.
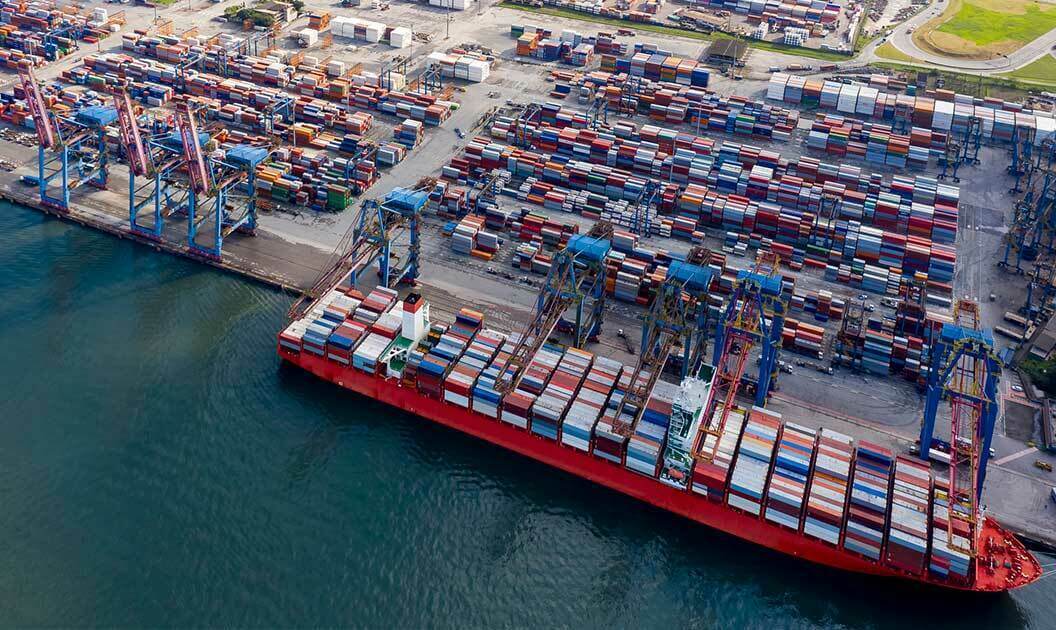
Ports are just as important as vessels when it comes to ocean shipping. Container terminals are differentiated by the average capacity they can handle in a year. This is typically measured in TEU (20 foot equivalent units) containers.
We’ve provided shipping container statistics for ports based on size. While mega ports end up impacting global trade on a larger scale, the large number of smaller ports shouldn’t be discounted when planning routes.
| Type of Port | Number of Ports |
| Small — Less than 300k TEU | 598 |
| Medium — 300 TEU to 1m TEU | 339 |
| Large — 1m TEU to 5m TEU | 171 |
| Mega — more than 5m TEU | 17 |
Provided by Statista
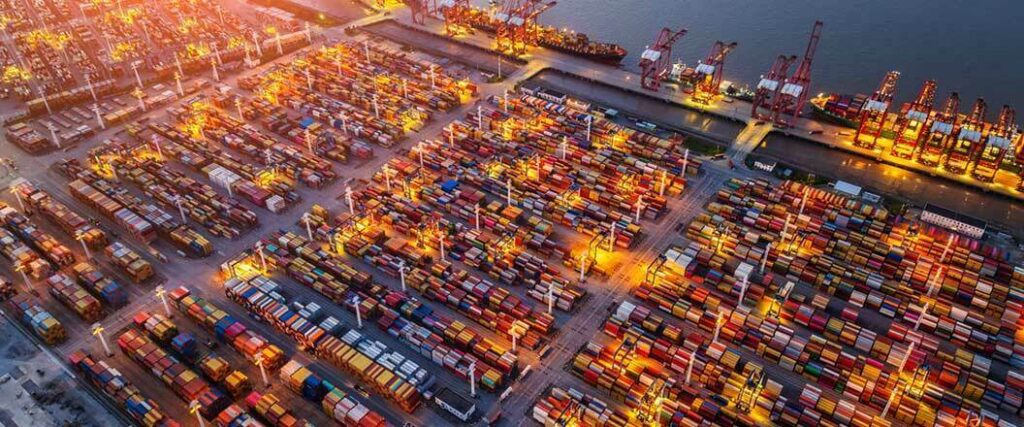
The high volume of container freight necessitates the use of container ports of varying sizes around the world. That said, certain terminals process more throughput than others.
Throughput refers to the amount of cargo that a port processes. We’ve included a list of the top ports in the world based on the amount of freight they handle.
| Port | Amount of Cargo Processed |
| Shanghai | 47.28 |
| Singapore | 37.29 |
| Ningbo-Zhoushan | 33.36 |
| Shenzhen | 30.04 |
| Qingdao | 25.66 |
| Guangzhou | 24.6 |
| Busan | 22.07 |
| Tianjin | 21.03 |
| Los Angeles/Long Beach | 19.04 |
| Hong Kong | 16.58 |
Provided by Statista
Many of these ports are located in China. The country is home to a large manufacturing sector that provides products to businesses around the world. The high volume of goods leaving China contribute to massive amounts of throughput.
Despite there being a record increase of TEU capacity in 2023, BIMCO predicts this record will be beaten in 2024.
BIMCO notes that ship recycling will increase in 2024, but they don’t specify by how much. That said, BIMCO still estimates a growth of 2.8 million TEU capacity when recycling is factored in.
Ship recycling is when vessels are dismantled at the end of their operational life. The extracted parts are reused or turned into raw materials.
Learn about the types of container ships that are used to transport freight all over the world.
Containers travel all over the world on various trade routes. Three in particular are extremely popular pathways. Consider the data on the amount of containerized cargo that’s transported on these routes.
| Trade Route | Amount of Containerized Cargo |
| Trans-Pacific | 32.7 Million |
| Europe-Asia-Europe | 26.3 Million |
| Atlantic Route | 8.9 Million |
Provided by Statista
The Trans-Pacific trade route connects the Americas, Oceania, and Asia. As the data shows, this trade route carries the largest amount of cargo in terms of load size. Many countries in these regions are part of the Trans-Pacific Partnership (TPP), which helps explain why the route is used so frequently.
Europe and Central Asia have an extremely strong trade relationship. In 2021, the European Union (EU) accounted for 23.6 percent of combined foreign trade for countries in Central Asia.
The Atlantic Route is frequently used to send goods between countries in North and South America and the EU. Nations in these continents have relatively positive trade relations.
Due to large amounts of freight traveling across the ocean, the need for container ship space has risen. Between the 2021 and 2022, there was an increase in the deployment of container ship capacity for certain shipping lanes.
| Lanes | 2021 Capacity | 2022 Capacity |
| Asia — North America | 4.15 Million | 5.45 Million |
| Asia — Europe | 4.9 Million | 5.4 Million |
| Latin America | 2.9 Million | 3.1 Million |
| Middle East/ISC | 2.85 Million | 2.9 Million |
Provided by Statista
The deployment of container ship capacity refers to the allocation of vessels to specific routes. Data reflected in the table shows the Asia-North America and Asia-Europe lanes that saw the largest increase. Considering the load sizes transported on the Trans-Pacific and Europe-Asia-Europe routes, it’s no surprise the Asia-North America and Asia-Europe lanes saw the largest increase.
Shipping cargo in containers overseas is projected to grow in the years to come. As a result, this market will earn more revenue with each successive year.
| Year | Projected Growth |
| 2024 | $10.9 Billion |
| 2025 | $11.3 Billion |
| 2026 | $12.65 Billion |
| 2027 | $14.17 Billion |
| 2028 | $15.87 Billion |
Provided by Statista
Rather than a sudden increase, the data shows a steady growth of revenue for the global shipping container market. Unless another global event like COVID-19 were to occur, this projection is likely to stay the same or increase.
Shipping containerized freight requires a good deal of coordination. Fortunately, USA Freight Forwarding can handle all of these responsibilities. With our ocean freight shipping services, we’ll handle all the preparations that need to be made for your cargo to travel to another country.
Other services we use include:
When you choose USA Freight Forwarding, your shipping experience will be a breeze. If you’re ready to get started, then contact our team at (866) 941-8081. You can also begin using one of our premier services by contacting us through our site.

Statista, Number of Sea Terminals In 2022, by Size, 2024
Statista, Deployment of Container Ship Capacity Worldwide January 2021 to January 2022, 2024
Statista, Estimated Containerized Cargo Flows On Major Trade Routes In 2022, 2024
Statista, The Largest Container Ports Worldwide In 2022, Based On Throughput, 2024
Statista, Projected Size of the Global Shipping Container Market 2020-2028, 2024
Niels Rasmussen, Record Deliveries Could Push Container Fleet Above 30 Million TEU in 2024, 2024
Niels Rasmussen, Container Shipping Market Overview & Outlook Q4 2023, 2023